Data Study
How Long Do Stale Quotes Last? A Latency Arbitrage Data Study on XAUUSD at Three Brokers
Updated 8 October 2026 · Westernpips · About 20 minutes to read
In three recorded XAUUSD sessions on different days, a fast reference feed was ahead of a retail broker’s displayed quote by more than 30 points 240 to 824 times an hour. The median window stayed open 34 to 56 ms, and 19% to 31% of windows lasted more than 100 ms. An order delayed by 30 ms would have captured about +22 and +12 points gross on displayed quotes at the first two brokers, but only +2 at the third, whose 46-point (4.6-pip) spread absorbs most of the edge.
We took real tick recordings from three Westernpips Private 7 sessions and measured the windows ourselves. This page shows what those recordings contain, how the numbers were computed, which checks they survived, and what they cannot tell you. It is a companion to the full guide to latency arbitrage. The brokers are called A, B and C, and their names are withheld.
- The three brokers refreshed their displayed quote 2.7, 9.2 and 6.2 times a second, against 12 to 28 times a second for the fast feed.
- Window length was in the same range everywhere (median 34, 50 and 56 ms at a 30-point gap) but wide: 22% to 35% closed within 20 ms and 19% to 31% stayed open past 100 ms.
- The mean gross result per signal fell with delay at every broker, but the delay at which it reached zero differed: past 150 ms at broker A, about 90 ms at B and about 40 ms at C.
- Broker C’s 46-point (4.6-pip) spread made random entries lose 49 points. Its signals beat random entries by 20 to 50 points at delays up to 150 ms, but the spread decided the outcome.
- Counting windows is not enough. A second, noisier feed in broker A’s session gave 4.6 times as many signals and almost no edge.
- For broker A the numbers were reproduced on the Westernpips BackTester’s own CSV export.
- The BackTester’s own list of 210 simulated trades at broker A averaged +60.8 points gross with an assumed order time of about 14 ms. The same entries delayed by a further 50 ms and closed after one second averaged +18, and +9 at 100 ms.
- The data show displayed quotes only. Commission, slippage, rejections and last look are not included, so the results are an upper bound.
Why We Ran It
Search for how long a latency arbitrage window lasts in retail forex and the answers are ranges: 50–200 ms, sometimes less. The sources are broker blogs, software vendors and hosting sellers. The peer-reviewed numbers, such as the London Stock Exchange study covered in our review of the research, are about equities and microseconds.
We decided to run our own study of this question. We took real tick recordings from three Westernpips Private 7 sessions, at three brokers on three days, and measured them the same way. The aim was to see how long the quotes actually stayed stale, whether the answer was the same at every broker, and how a delay changed what a signal was worth. This is not a proof that the strategy works. It is a measured look at three recordings.
The Three Recordings
| Item | Broker A | Broker B | Broker C |
|---|---|---|---|
| Date | 6 October 2026 | 26 May 2026 | 23 February 2026 |
| Session (recorder time) | 08:34–15:54 (7 h 19 min) | 08:53–14:12 (5 h 19 min) | 09:07–17:03 (7 h 56 min) |
| Gold price range (bid) | 4,143–4,180 | 4,501–4,541 | 5,140–5,219 |
| Fast feed updates | 327,588 (12.4 per s) | 538,465 (28.1 per s) | 457,011 (16.0 per s) |
| Fast feed median spread | 15 points (1.5 pips) | 12 points (1.2 pips) | 11 points (1.1 pips) |
| Broker updates | 71,936 (2.7 per s) | 177,133 (9.2 per s) | 178,627 (6.2 per s) |
| Median wait between broker updates | 272 ms | 38 ms | 112 ms |
| Broker median spread | 10 points (1.0 pip) | 12 points (1.2 pips) | 46 points (4.6 pips) |
| Longest pause in the broker feed | 12.4 s | 4.0 s | 130 s (5 pauses over 15 s) |
| Mid-price difference to the fast feed | median +1, std 19 | median 0, std 22 | median about 0, std 87 |
A point is 0.01 USD per ounce, the unit the BackTester uses. Gaps, spreads and results below are in points. 1 pip on gold is taken as 10 points; some brokers define a gold pip differently. Timestamps are the moment each tick reached the recording server, with one clock for both sources, so they include each feed’s own delivery time. That is the right view for a strategy running on that server, but it is not what the broker’s own system sees.
This is not a controlled comparison. The three sessions are different days, at different price levels, and the fast reference feed is the same service but not guaranteed to be the same instance or to have the same delivery path each time. Differences between the columns say something about these sessions and may or may not generalise to the brokers.
For broker A we also have the same session exported as CSV from the Westernpips Private 7 BackTester Debug tab (688,643 rows, 1 ms resolution, with the program’s own gap columns). It holds no trades, because order opening was switched off in that session. It is used in the cross-check.
Method
- Cross-side gap. At every tick of either source, take the larger of two numbers: fast bid minus broker ask (a buy opportunity) and broker bid minus fast ask (a sell opportunity). Both spreads are already inside this number.
- Window. A window opens at the first tick where the gap exceeds a threshold and closes at the first tick where it does not. Because the gap changes only when a quote changes, the length is exact within the recording. The thresholds are absolute, 30 and 50 points, so the three brokers can be compared. For brokers A and B, 30 points is about three times the median spread. For broker C it is less than the spread.
- Signal. The opening of a window. To reflect a one-second minimum between entries, signals closer than 1,000 ms to the previous one were dropped.
- Simulated trade. The order reaches the broker D ms after the signal and fills at the displayed quote at that moment (ask for a buy, bid for a sell). It is closed 1 second after it arrived at the opposite quote. The spread is therefore paid inside the result, and no information from after the entry is used to choose the exit.
- Control. The same calculation on random times and random directions. If the method were creating profit out of nothing, the control would show it.
Result 1: How Long Windows Last
| Gap threshold and broker | Windows | Per hour | Median | 75th percentile | 90th percentile | Under 20 ms | Over 100 ms |
|---|---|---|---|---|---|---|---|
| 30 points, A | 1,908 | 260 | 50 ms | 126 ms | 217 ms | 22% | 31% |
| 30 points, B | 4,385 | 824 | 34 ms | 75 ms | 200 ms | 35% | 19% |
| 30 points, C | 1,902 | 240 | 56 ms | 99 ms | 201 ms | 24% | 25% |
| 50 points, A | 272 | 37 | 25 ms | 54 ms | 212 ms | 41% | 15% |
| 50 points, B | 773 | 145 | 16 ms | 40 ms | 74 ms | 56% | 6% |
| 50 points, C | 768 | 97 | 46 ms | 98 ms | 211 ms | 30% | 24% |
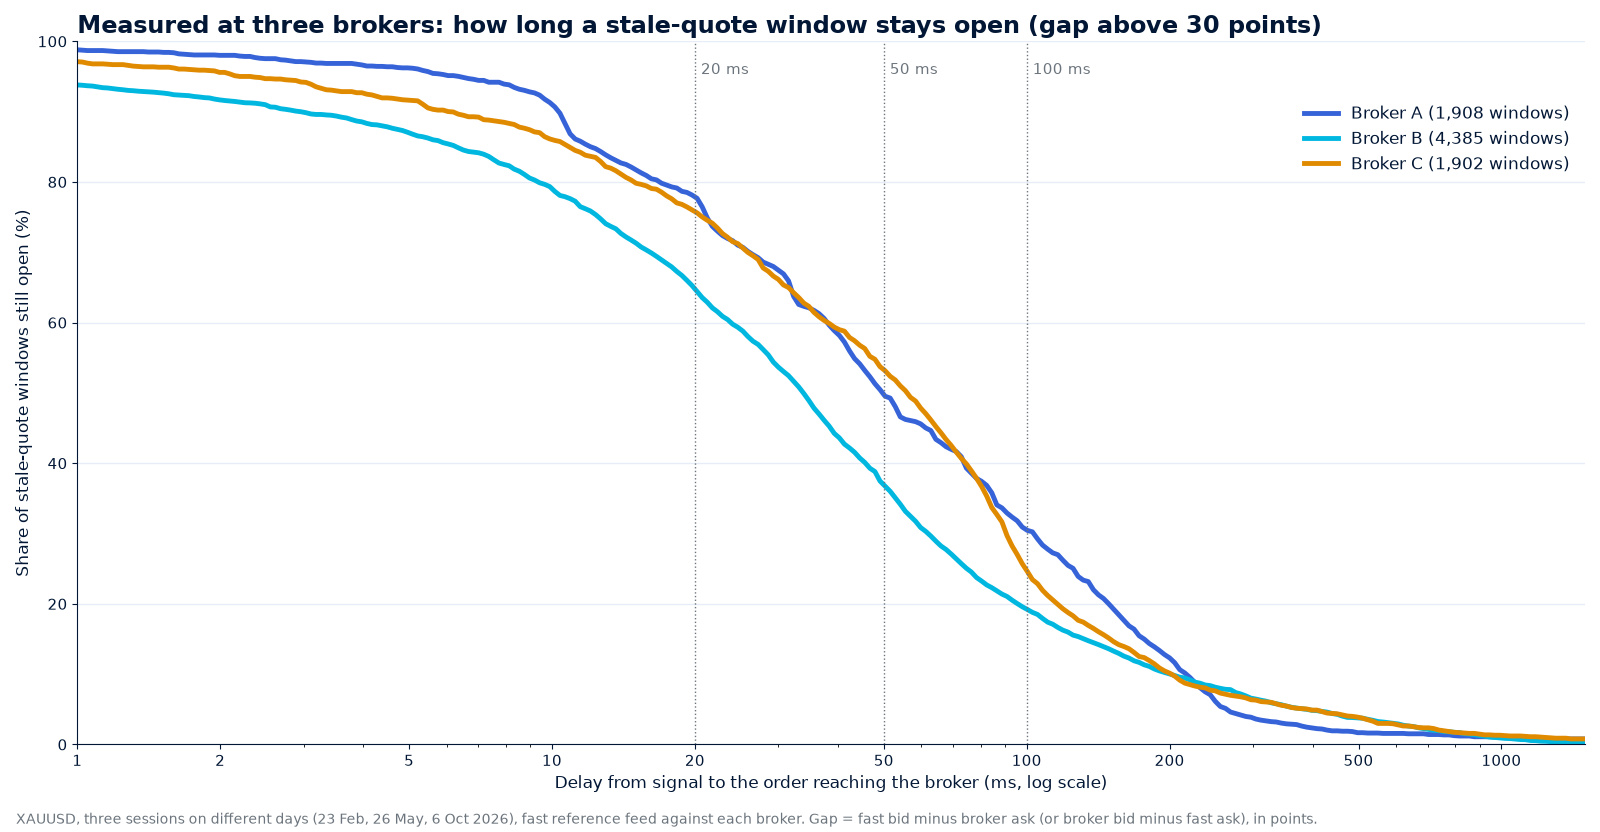
The share still open at selected delays, at the 30-point gap:
| Delay to broker | 10 ms | 20 ms | 30 ms | 50 ms | 100 ms | 150 ms |
|---|---|---|---|---|---|---|
| Broker A | 91% | 78% | 67% | 50% | 31% | 20% |
| Broker B | 79% | 65% | 54% | 37% | 19% | 14% |
| Broker C | 86% | 76% | 66% | 53% | 25% | 15% |
Three observations. The distributions are wide, so a single “window” number hides most of the picture: every median sits next to a 90th percentile of about 200 ms. Larger gaps are shorter-lived at every broker, which is consistent with bigger moves being repriced sooner, though the data cannot show why. And about 70% of the 30-point windows closed because the broker updated its quote at all three brokers, with the rest closing because the fast price moved back.
The recordings also show how old the broker’s quote was each time the fast feed ticked.
| Age of the broker quote at a fast-feed tick | Broker A | Broker B | Broker C |
|---|---|---|---|
| Median | 164 ms | 57 ms | 75 ms |
| 90th percentile | 466 ms | 452 ms | 448 ms |
| Older than 100 ms | 68% | 38% | 34% |
| Older than 200 ms | 40% | 23% | 17% |
An old quote is not the same as a wrong one. At broker A the median quote age was 164 ms, yet the median window was 50 ms, because a quote counts as mispriced only when the fast price has moved by more than the threshold.
Result 2: What a Delayed Order Captures
Mean gross result per signal, in points, for the 30-point gap (95% interval in brackets). The number of signals, one second apart, was 1,468 for broker A, 2,233 for B and 1,381 for C.
| Delay to broker | Broker A | Broker B | Broker C |
|---|---|---|---|
| 10 ms | +28 (27 to 30) | +17 (15 to 18) | +7 (4 to 9) |
| 20 ms | +25 (23 to 27) | +15 (13 to 16) | +5 (2 to 7) |
| 30 ms | +22 (20 to 24) | +12 (10 to 14) | +2 (about 0 to 5) |
| 50 ms | +16 (15 to 18) | +6 (5 to 8) | −2 (−4 to +1) |
| 100 ms | +10 (9 to 12) | −1 (−3 to 0) | −17 (−19 to −14) |
| 150 ms | +6 (4 to 7) | −3 (−5 to −2) | −28 (−31 to −26) |
| Random entries, same hold | about −9 | about −12 | about −49 |
For the larger 50-point gap (224, 444 and 566 signals):
| Delay to broker | Broker A | Broker B | Broker C |
|---|---|---|---|
| 10 ms | +46 | +42 | +24 |
| 30 ms | +25 | +32 | +19 |
| 50 ms | +16 | +22 | +12 |
| 100 ms | +7 | +7 | −4 |
| 150 ms | +5 | +3 | −20 |
| Random entries, same hold | about −9 | about −12 | about −49 |
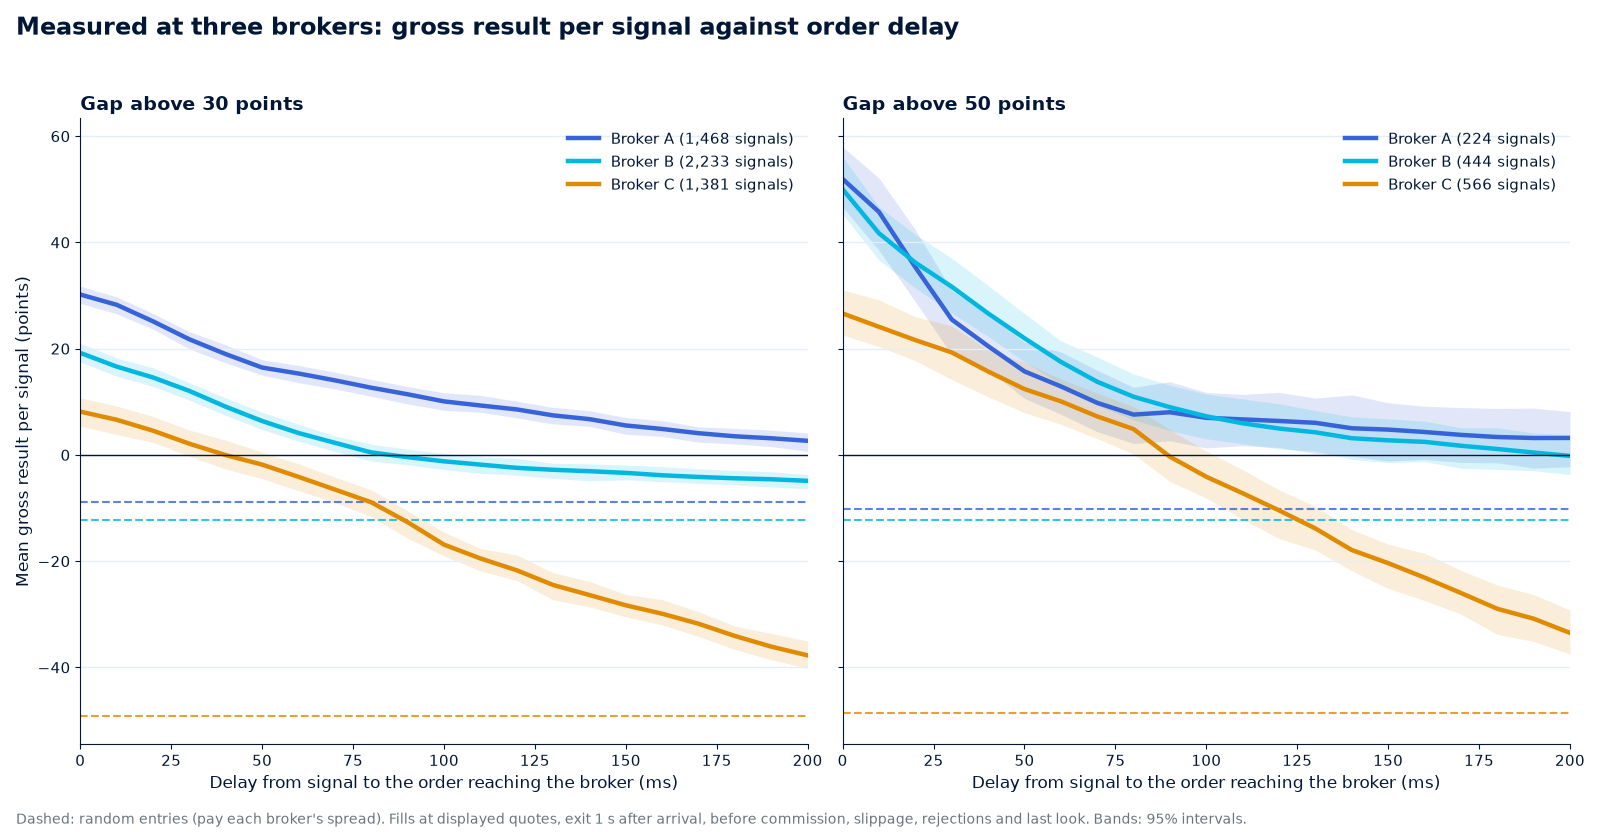
Reading the 30-point table by interpolation, the mean result reached zero at roughly 90 ms at broker B and roughly 40 ms at broker C, and had not yet reached it at 150 ms at broker A. At the 50-point gap the crossing moved to roughly 90 ms at broker C and past 150 ms at the other two. The earlier toy model in our worked examples, which turned negative at about 32 ms, is closest to broker C. It treats an order as fully in time or fully late, while brokers A and B moved toward the fast price in small steps, so a late order still caught part of the move.
Why the Brokers Differ
The data cannot prove causes, but they point to a few things worth checking at your own broker.
- Update frequency. Broker A refreshed its quote 2.7 times a second, with a 272 ms median wait. At the 30-point gap its windows paid the most at every delay. Broker B refreshed 9.2 times a second with a 38 ms median wait, had the shortest windows and the fastest decay. That is the direction you would expect, though three sessions are too few to call it a rule.
- Window count is not edge. Broker B had more than three times as many windows per hour as broker A (824 against 260) and about half the result per signal at 30 ms. More windows came with shorter ones.
- Spread. Broker C quoted a median spread of 46 points (4.6 pips), roughly four times the others. Random entries lost 49 points there, and its signals beat random entries by 20 to 50 points at delays up to 150 ms, yet the result crossed zero at about 40 ms. A wide spread is a cost paid on every trade, so the delay you can afford shrinks.
- Frozen quotes. Broker C’s feed paused five times for 30 to 130 seconds. A displayed price that is not updating is not an executable one. The few signals that opened in windows longer than 5 seconds lost 46 to 78 points each (two at the 30-point gap, four at 50), whatever the delay.
- Noise in the comparison. The mid-price difference between the fast feed and broker C had a standard deviation of 87 points, against 19 and 22 for A and B. The fast feed and broker C do not track the same price as closely, which makes a gap harder to trust.
Robustness Checks
| Gap above 30 points, 30 ms delay (mean, points) | Broker A | Broker B | Broker C |
|---|---|---|---|
| First half of the session | +21 | +11 | +6 |
| Second half of the session | +23 | +13 | −2 |
| Buy signals | +23 | +12 | +1 |
| Sell signals | +21 | +12 | +3 |
| Random entries | −9 | −12 | −49 |
- Brokers A and B gave the same sign in both halves of the session and for both trade directions. Broker A’s result by hour stayed between +19 and +24 points at 30 ms.
- Broker C at the 30-point gap is not stable: its 30 ms result is within noise of zero, and the second half is slightly negative. At the 50-point gap it was stable (+21 and +18 in the two halves, +19 and +20 for buys and sells).
- Control. Random entries lost about the spread at every broker, so the method does not create a profit from nothing.
- Different holds. At broker A, a 0.3 s hold gave +16 and a 3 s hold +21 at 30 ms, against +22 for the 1 s hold shown.
- A second view of the lag at broker A. Shifting the fast feed back in time and checking where it matches the broker mid-price best put the broker about 100–110 ms behind. The improvement over no shift is small (mean absolute difference 15.0 to 14.8 points), because the two feeds also differ for reasons unrelated to timing. It agrees with the window results but is not a precise measurement.
Cross-Check on the Program’s Own Export
Everything above was computed from the raw tick files with our own code. To see whether the numbers depend on that code, we repeated the calculation for broker A on the CSV that the Westernpips BackTester exports from its Debug tab. That file was produced by the program, not by us, and contains its own gap columns.

The gap is the same quantity
The export’s buy-gap column matches the cross-side gap we computed from the raw files to within 0.0000000001 (correlation 1.000). The sell-gap column is the same number with the opposite sign. So the gap used in this study is the quantity the software itself reports, in points of 0.01 USD.
The results reproduce
| Broker A, gap above 30 points | Raw tick files | Program export |
|---|---|---|
| Windows | 1,908 | 1,916 |
| Median window | 50 ms | 49 ms |
| 90th percentile | 217 ms | 217 ms |
| Closed within 20 ms | 22% | 22% |
| Open longer than 100 ms | 31% | 30% |
| Signals, 1 s apart | 1,468 | 1,469 |
| Mean result at 30 ms delay | +22 | +22 |
| Mean result at 100 ms delay | +10 | +10 |
The export holds fewer rows than the raw files (11% fewer fast-feed updates and 0.5% fewer broker updates, because the program drops repeated or invalid ticks) and its timestamps are rounded to 1 ms, which accounts for the small differences. The conclusions do not change.
The choice of reference feed changes everything
Broker A’s session recorded a second fast feed. It quotes about 2,765 points above the others, so we removed that median offset before comparing it with the broker. If the offset drifts during the day, the drift creates false gaps. The result with the same method and the same thresholds:
| Broker A, gap above 30 points | First fast feed | Second fast feed |
|---|---|---|
| Windows per hour | 262 | 1,927 |
| Median window | 49 ms | 72 ms |
| 90th percentile | 217 ms | 800 ms |
| Signals, 1 s apart | 1,469 | 6,800 |
| Mean result at 30 ms delay (points) | +22 | +3 |
| Positive at 30 ms delay | 76% | 50% |
| Export rows with a crossed or zero-spread quote | 0 | 3,044 |
The second feed produced 4.6 times as many signals, but they earned almost nothing: +3 points at a 30 ms delay, against a loss of about 9 points for random entries. Most of its windows are therefore not the broker being slow. They are differences between two sources that are not tracking the same price, and the 3,044 export rows with a crossed or zero-spread quote show how noisy that feed is. The data cannot say which feed is wrong, only that a feed that produces many windows is not the same as a good one. Compare feeds with a control like the one above before trusting any count of windows. The documentation page on checking which quote feed is faster addresses the same problem.
The Program’s Simulated Trades at Broker A
The tick export used above contains no orders, so we asked for a second export from the same session: the Opportunities tab of the Westernpips Private 7 BackTester, which lists every trade the program simulated on the recorded quotes. The run used one fast source against broker A, an open gap of 50 points, a take profit of 15 points from entry, a stop loss of 15 points from the signal, one position at a time, and the option not to close a profitable position while the gap is still active.

| Item | Value |
|---|---|
| Simulated trades | 210 (107 buys, 103 sells) |
| Closed by take profit / stop loss | 206 / 4 (98% take profit) |
| Mean result per trade | +60.8 points |
| 95% interval for the mean | +56.8 to +65.0 points |
| Median; 5th to 95th percentile | +57.5; +29 to +111 points |
| Worst / best trade | −63 / +191 points |
| Buys / sells, mean | +63.9 / +57.6 points |
| Time in the trade: median; 90th percentile; longest | 318 ms; 1.24 s; 9.5 s |
| Order execution time at open: mean; median; longest | 13.7 ms; 10 ms; 240 ms |
| Order execution time at close, mean | 44.5 ms |
| Slippage at open | 0 in all 210 trades |
| Slippage at close | nonzero in 16 trades, mean −0.04 points |
Check against the raw ticks. For 200 of the 210 trades (95%), the program’s profit equals the broker’s displayed opposite quote at the close time minus its displayed quote at the open time, to within half a point, when we read both from our own copy of the tick files. The backtest therefore does what it says: it prices trades off the displayed quotes. We have not explained the other 10 trades.
What happens when the order is later. The recorded order time averages about 14 ms. To see how much that assumption matters, we took the same 210 entries, delayed each one by an extra amount, and closed it one second later at the opposite displayed quote, the same fixed exit used in Result 2. The spread is paid inside each result.
| Extra delay on the same entries | Mean result, points | 95% interval, points | Trades with a profit |
|---|---|---|---|
| None (as recorded) | +53.9 | +47.8 to +60.0 | 94% |
| 14 ms | +45.3 | +39.5 to +51.7 | 90% |
| 30 ms | +29.0 | +23.3 to +35.2 | 76% |
| 50 ms | +18.4 | +12.6 to +25.1 | 64% |
| 100 ms | +9.3 | +3.9 to +15.4 | 54% |
| 150 ms | +6.1 | +0.8 to +11.8 | 54% |
Two things follow. First, the program’s own exit rule, which waits for the gap to close, added about 7 points over a fixed one-second exit on the same entries (+60.8 against +53.9), so the choice of exit is not what drives the result. Second, the result is very sensitive to the order time: an extra 50 ms removes about two thirds of the mean and an extra 100 ms about five sixths. That is the same shape as Result 2 at the 50-point gap (+46 at 10 ms, +25 at 30 ms, +7 at 100 ms), obtained here from the program’s entries instead of ours.

Execution time and slippage can be set in the BackTester
The list above is only as realistic as the execution assumptions behind it. In the provider settings of the BackTester you can set the order execution time in milliseconds and the slippage in points separately for opening and for closing, with separate values for positions and for opportunities. There are also fields for a zero-slippage percentage and for commission. If you enter the delay and slippage you measured with real orders at the minimum lot, the backtest gives results much closer to real execution than a run with default values. It is still a model: it applies the numbers you give it, so the result is only as realistic as those inputs, and it does not reproduce rejections or last look.

That is the natural next step for this study: rerun the same session with the execution time and slippage measured at your broker, and compare the result with the zero-slippage run above.
What the Study Cannot Show
- Executable prices. The files hold displayed quotes. The program’s tick export contains no orders (its position, opportunity and profit columns are zero throughout, because order opening was off), and the list of simulated trades described above is a backtest on the same quotes, not a log of real fills. A broker can fill, requote or reject an order at a different price. Last look or an added delay would bring back the sharp cut-off that these data do not show.
- Costs. Commission, slippage on both legs, swap and any markup are not in the results. The figures are gross price moves in points, not account returns, and not a return on any deposit.
- Real order delay. The “delay” is the time from signal to the order arriving at the broker. It must be measured with real orders. It is not a ping.
- Three sessions, three days. One session per broker, on different dates and price levels, with a fast feed that may not have been identical each time. The differences between brokers are not a ranking, and a broker can change its pricing at any time. A broker that sees a profitable pattern can also respond (see how brokers respond and the contractual limits). Nearby signals share the same underlying move, so the intervals are narrower than they would be across independent days.
- Cause. The data show that a broker’s quote was behind, not why. Delivery delay to the recorder, throttled publishing and the broker’s own pricing chain all look the same in this view.
What to Do With This
- Treat window figures as distributions. Ask for the median and the 90th percentile at a stated gap, not a range. A range without a threshold says very little.
- Do not carry one broker’s numbers to another. In these sessions the delay at which a signal stopped paying ranged from about 40 ms to more than 150 ms.
- Start with the spread. A broker with a spread four times wider needs gaps and speed to match. Random entries are a quick way to see the cost.
- Record your own pair of feeds for several days and hours, using the method in how to measure a broker yourself. In Westernpips Private 7, the BackTester Debug tab exports every tick as CSV with both quotes, the time of each quote and the program’s gap columns, which is enough to repeat this study. The documentation page on checking which quote feed is faster covers the same question inside the product.
- Compare reference feeds with a control. More windows is not better. Run random entries through the same calculation, and trust only a feed whose signals clearly beat them.
- Measure your order delay with real orders at the minimum lot, and test fills before anything else. The gap between displayed and executed prices is where this kind of result usually disappears. Record slippage, rejections and hold times for a few dozen trades, then enter the measured execution time and slippage into the BackTester’s provider settings and rerun the session.
- Read the broker’s terms. Profitable patterns can be treated as breaches of the client agreement.
Westernpips Private 7 is described on the product page and in the HFT trading platform and terminal guide. This page is published by the vendor, and the recordings came from our own software, so it is a case study to be repeated and checked, not an independent audit.
Data Study FAQ
How long do stale quotes last at a retail broker?
How much does a delay cost in latency arbitrage?
Do all brokers behave the same?
Does this study show that latency arbitrage is profitable?
Why was the broker quote behind the fast feed?
Can I repeat the study on my own broker?
Does the choice of reference feed matter?
Do the program's own simulated trades agree with this study?
Risk warning: trading leveraged products involves a high risk of loss. This page is educational and is not investment advice. It reports recorded quotes from three sessions and shows displayed prices, not executed trades. Past market behaviour does not indicate future results, and execution, spreads and permitted strategies vary by broker.
Review the published trading statements with their account conditions, reporting periods, costs and drawdowns. Results from another setup do not establish the returns or execution quality available to your account.
Explore Westernpips software and supported connections on the product page. Choose a setup by evaluating instrument coverage, provider access, quote quality, order handling and execution logs.
Westernpips Private HFT Trading Tools
Since 2007, Westernpips has been a global leader in arbitrage technology for low-latency traders.
Our mission is to continuously innovate, refine, and deliver advanced solutions in algorithmic trading — helping not only our own teams but also our customers, partners, and investors achieve consistent profitability.
We specialize in high-frequency algorithmic trading and arbitrage across multiple markets, including Forex, CFDs, futures, and cryptocurrencies. With a reputation built on innovation and results,
Westernpips continues to push boundaries, empowering traders with the speed, precision, and efficiency required to thrive in today’s markets.


Contact Us
If you are a trader or investor and you are interested in HFT trading technology, please Contact Us for advice.
westernpips_hft_trading[email protected]