Latency Arbitrage
What Is Latency Arbitrage? How It Works in Forex Trading
Latency arbitrage is a trading strategy that profits from a quote that is out of date. A trader sees a price change on a fast source, then trades against a slower venue or broker that has not yet updated its quote. The edge comes from speed, not from predicting direction, and it lasts only until the slow quote catches up.
How latency arbitrage works
-
Fast feed updates
A new bid or ask arrives from the reference source.
-
Compare Bid and Ask
If the fast bid is above the broker ask, or the broker bid is above the fast ask, by more than the threshold, a window is open.
-
Send the order
Buy at the broker ask, or sell at the broker bid, while the slow quote is still stale.
-
Check fill and close
Confirm execution, then close when the gap is gone, a take-profit or stop is hit, or the quote has already moved.
What you need
A quote source that shows the new price before the broker does.
A live account that receives the broker quote and can send orders.
Hosting close enough to the feed and the broker that the order can still land inside the window.
Software that compares the two quotes, applies thresholds and sends the order.
Logs of fills, rejections, slippage and delay, so you can see whether the displayed quotes were actually traded.
That definition fits a stock exchange and a retail forex broker alike, but the economics differ. This guide covers both, with numbers: what peer-reviewed research measured on exchanges, three worked examples with every cost shown, a break-even model for speed, how brokers respond, what the law and client agreements say, and how to test a broker before risking real money.
For retail gold we ran our own study, the Westernpips XAUUSD Latency Study (2026). We took real tick recordings from three Westernpips Private 7 sessions at three brokers and measured the windows ourselves. At a 30-point gap the median was 34 to 56 ms, and the delay at which a signal stopped paying ranged from about 40 ms to over 150 ms.
- Latency arbitrage trades a stale quote against information that is already public somewhere else. It needs speed, not a forecast.
- On exchanges, research found races about once a minute per FTSE 100 stock, with the typical race lasting 5–10 millionths of a second.
- In our retail forex example a 2.0 pip headline gap leaves 0.8 pip after costs, and an order that arrives late loses 1.6 pips.
- Published “windows” of 50–200 ms on retail brokers are vendor claims. In three recorded gold sessions at three brokers the median was 34 to 56 ms, but windows ranged from under 20 ms to over 200 ms, and the delay at which a signal stopped paying ranged from about 40 ms to over 150 ms. Measure your own.
- It is rarely a crime, but client agreements often let a broker void trades, and UK ombudsman decisions have backed brokers.
How a Broker Quote Reaches the Terminal
A retail broker quote is not born in the terminal. It is a message that started at a liquidity venue and was copied, marked up and republished before you see it.

What Latency Arbitrage Is, and Is Not
The academic definition is narrower than most blog posts suggest. Budish, Cramton and Shim (2015) define latency arbitrage as arbitrage rents from symmetrically observable public information. Everyone can see the new price. The profit goes to whoever acts on it first, against someone whose quote has not moved yet. It is a race, not a forecast. The trader does not need to know where the price is going, only that a quote somewhere is now wrong.
That precision matters, because the term is often stretched to cover any fast trading. The table separates it from strategies it gets confused with.
| Strategy | What it trades | Needs a price forecast? | Speed-critical? |
|---|---|---|---|
| Latency arbitrage | A stale quote against a price change already public elsewhere | No | Yes, it is the whole edge |
| Triangular arbitrage | Three related currency pairs that are inconsistent at the same moment | No | Yes, but prices are compared at one instant |
| Statistical arbitrage | Related instruments that usually move together and have drifted apart | Yes, a statistical one | Not usually |
| Market making | The spread, by quoting both sides continuously | Partly | Yes, to avoid being the stale quote |
| News trading | The price reaction to a scheduled release | Yes | Yes, but a different race |
| Scalping | Small moves on the trader’s own signal | Yes | Not necessarily |
Latency arbitrage is also not the same as HFT software as a category. High-frequency trading covers market making, statistical strategies and more. Latency arbitrage is one use of speed among several, and the one that draws the most criticism, because the person on the other side of the trade is a liquidity provider whose quote was simply too slow.
Why Quotes Go Stale
No quote is ever current. Every price is a message that took time to travel, be processed and be republished. Five mechanisms create the gaps that latency arbitrage trades.
- Distance. Light needs several milliseconds one way between Chicago and New York even in a straight line, and longer through fibre. Between London and New York it is tens of milliseconds. Nothing can remove that floor.
- Processing queues. Matching engines, gateways and risk checks handle messages one at a time. Budish and co-authors point to this combination, continuous time plus serial processing, as the root cause: even if many participants see news at the same moment, somebody is first in the queue and collects the rent.
- Consolidation. In US equities, a consolidated price is computed and published after exchange data arrives, so a firm with direct feeds can know a better price before the public one updates. Wah and Wellman (2013) model exactly this delay between direct feeds and the consolidated quote.
- The broker pricing chain. A retail quote typically passes through a liquidity provider, an aggregator or bridge, a markup engine, the broker’s trading server and the client’s platform. Each step adds delay, and each can filter or throttle updates.
- Different information sources. Two venues may simply not see the same event at the same time, for example when a price moves in one market and a related instrument elsewhere has not yet reacted.
The same arithmetic applies in every case. If the stale quote stays wrong for longer than it takes you to see the change and reach it, there is something to trade. If not, there is not. The rest of this page is about how long that window lasts, what it costs to use it, and who ends up paying.
Where Latency Arbitrage Happens: Stocks, Forex and Crypto
| Venue | What goes stale | Who bears the cost | Evidence |
|---|---|---|---|
| Lit stock exchanges | A resting quote on one venue after the price moved on another venue or a correlated instrument | Market makers whose quotes are sniped, and through wider spreads, investors | Peer-reviewed message-level data from the London Stock Exchange |
| Dark pools | A midpoint reference price that lags the lit market | Passive liquidity providers in the dark pool | Regulatory participant-level data (BIS working paper) |
| Retail forex and CFD brokers | The broker’s quote against a faster liquidity-provider feed | The broker, or its liquidity provider if the order is passed on | No neutral public dataset. Vendor and broker commentary |
| Crypto exchanges | A price on a slower exchange after a move on a faster one | Market makers on the slower exchange | Same logic, with exchange API delays and fees added |
The first two rows are the best documented, because regulators could see failed orders as well as successful ones. The third row, retail forex, is the one most readers of this site care about, and it is the least documented. Keep that asymmetry in mind when reading claims about forex windows and profits.
What the Research and the Numbers Say
Exchanges: the best data that exists
Aquilina, Budish and O’Neill used message data from the London Stock Exchange, which records failed attempts to trade or cancel as well as completed trades. That lets a researcher see the losers of a race, which limit-order-book data hides. Their findings, published as UK Financial Conduct Authority Occasional Paper No. 50 (2020) and later in the Quarterly Journal of Economics (2022):
- Races are frequent: about one per minute for FTSE 100 stocks.
- Races are fast: the typical (modal) race lasts 5–10 millionths of a second.
- Races are a large share of volume: roughly 20% of trading volume.
- Participation is concentrated: the top three firms account for over half of race wins and losses.
- The cost is measurable: a latency-arbitrage “tax” of 0.42 basis points of volume, against an average effective spread of just over 3 basis points. The authors estimate that removing latency arbitrage would cut the cost of trading by 17%, and that the sums at stake are around 5 billion US dollars a year in global equity markets.
Two things follow for a reader considering the retail version. First, even on exchanges, where the profit pool is large, the wins go to a handful of firms competing at the microsecond scale. Second, the cost lands on market makers, which is why exchanges and brokers keep inventing defences (see how brokers and venues respond).
The BIS working paper “Sharks in the dark” (Aquilina, Foley, O’Neill and Ruf, 2023) studied dark pools, where trades execute at a reference price taken from the lit market. When that reference price is stale, a fast trader can trade against it before it updates, and the authors point to randomising execution times as a way to counter it.
Retail forex: an audit of the numbers you will meet
Search for latency arbitrage in forex and you find confident figures: windows of 50–200 ms, 0.5–3 pips per trade, break-even latencies of a few milliseconds. Most come from sellers of software, VPS hosting or broker defences. Here is how to weigh them.
| Claim | Typical source | Quality of evidence | How to treat it |
|---|---|---|---|
| “The gap lasts 50–200 ms” | Broker and software-vendor blogs | Unaudited, no published method | A range to measure, not a fact |
| “0.5–3 pips per trade” | Vendor guides | Usually before costs | An upper bound. Our worked example nets 0.8 pip |
| “Break-even latency is 5–25 ms” | A vendor’s self-published paper | A model; assumptions drive the answer | Useful for the shape. Check the inputs |
| “5 billion USD a year” | FCA paper, repeated everywhere | Peer-reviewed, but for equities | Not a number for forex |
| “Under 1 ms to the broker” | VPS and hosting sellers | Marketing | Measure round-trip time from your own server |
This is not a claim that those numbers are false. Some will be right for some brokers at some hours. The point is that none is a neutral measurement of retail FX, and every one can be replaced by a number you record yourself. The method is later in this guide.
Latency Arbitrage Examples With Every Cost Shown
All quotes below are hypothetical. They are chosen to make the arithmetic visible, not to describe a recorded trade or to suggest a return. Where an assumption drives the result, it is stated.
Example 1: EUR/USD, the order arrives in time
Quotes have five decimals, so one pip is 0.00010. The broker quotes a 1.0 pip spread. A fast liquidity-provider feed and the broker both show EUR/USD at 1.08500 bid just before the event. At time zero, the fast feed jumps.
| Time | What happens | Prices |
|---|---|---|
| 0 ms | The fast feed bid moves up | Fast bid 1.08500 → 1.08530 |
| 2 ms | Software compares the fast bid with the broker ask. The cross-side gap exceeds the 1.5 pip threshold, so it signals a buy | 1.08530 − 1.08510 = 2.0 pips |
| 14 ms | The order reaches the broker and fills. The broker quote is still stale | Fill 1.08512 (0.2 pip slippage) |
| 60 ms | The broker reprices | Bid 1.08526 / ask 1.08536 |
| 62 ms | The position is sold at the broker bid | Exit 1.08526: +1.4 pips from entry |
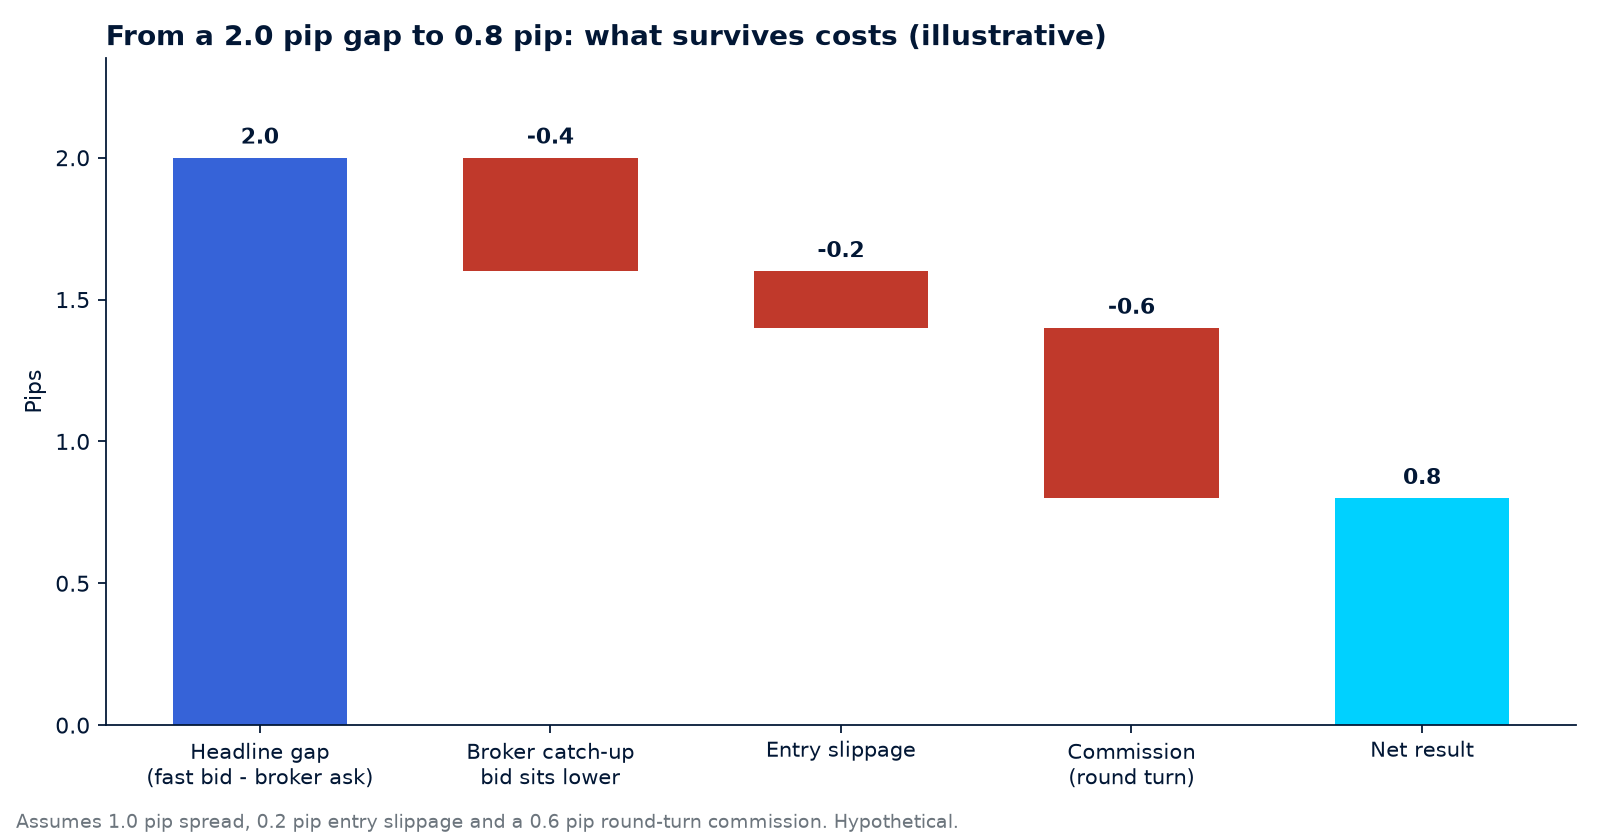
| Net | After a 0.6 pip round-turn commission (6 USD per standard lot) | 1.4 − 0.6 = 0.8 pip |
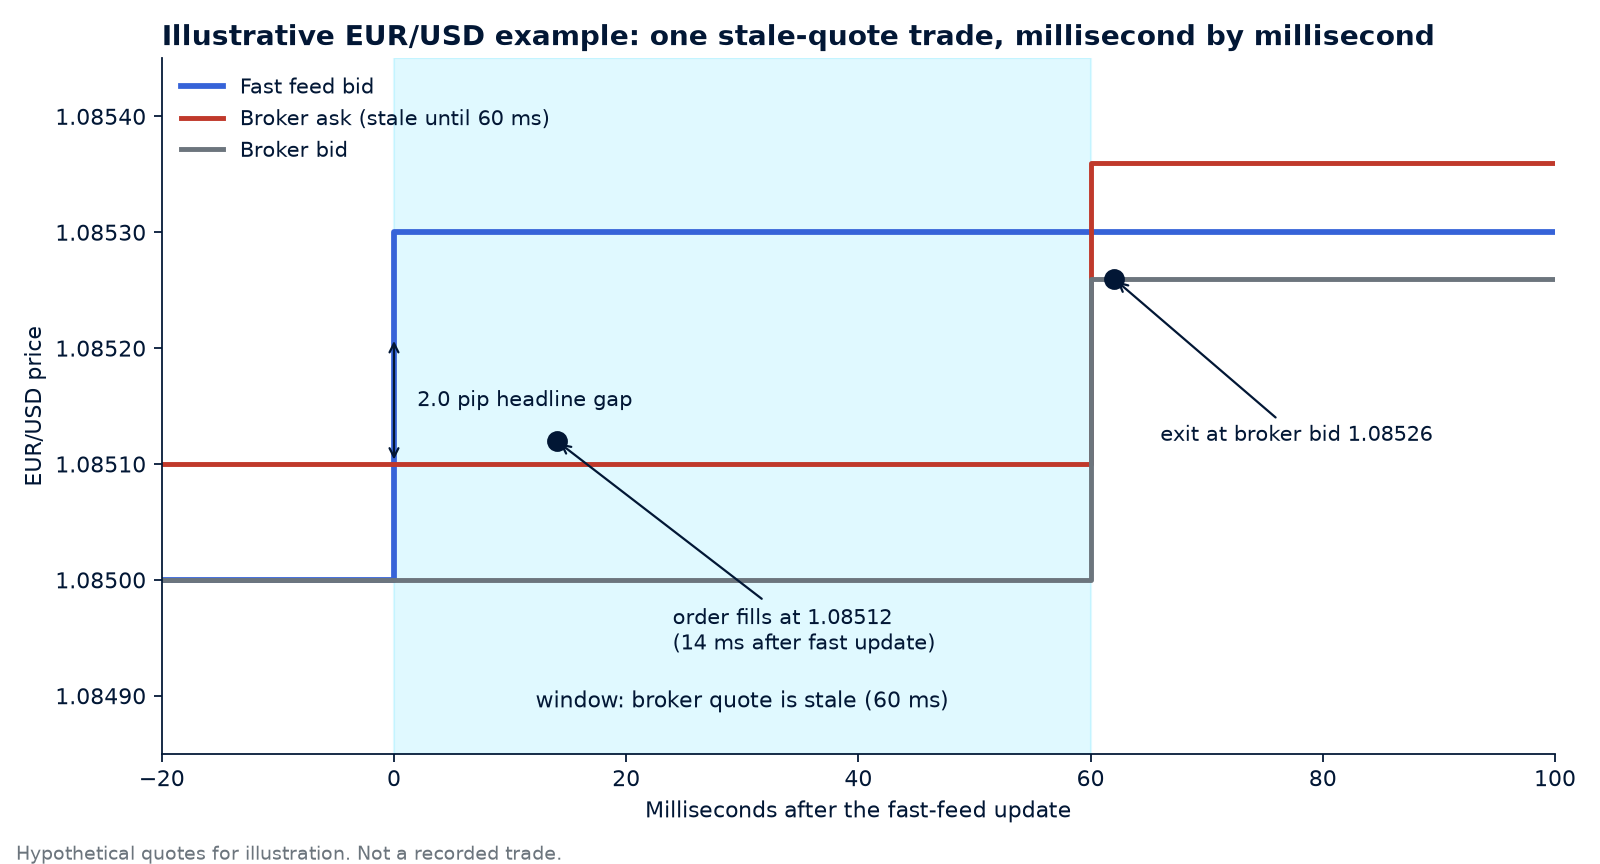
Read the result for what it is. The headline gap was 2.0 pips. Costs took 1.2 of them: 0.4 because the broker’s repriced bid sits below the fast bid, 0.2 slippage on entry and 0.6 commission. At a standard lot of 100,000 units, with a pip worth 10 USD on EUR/USD, 0.8 pip is 8 USD. At 0.10 lot it is 0.80 USD, and at the minimum 0.01 lot it is 0.08 USD. The strategy is a high-volume, thin-margin business, not a few large winners.
Example 2: the same signal, the order arrives late
Keep every price from Example 1 and change one thing: the order now takes 75 ms to reach the broker, for instance from a more distant server. The broker repriced at 60 ms.
- The buy fills at the new ask, 1.08536.
- Closing at the new bid, 1.08526, costs 1.0 pip, the full spread.
- Commission adds 0.6 pip. Result: −1.6 pips, or −16 USD per standard lot.
The payoff is lopsided: +0.8 pip when the order is in time, −1.6 pips when it is late. To break even, the order must be in time more than 1.6 / 2.4, which is 66.7% of the time, before counting rejected orders. Some brokers do not fill late orders at all; they reject them with last look, which turns this loss into no trade, and is one of the defences described below. A fast signal does not guarantee a fast fill. It guarantees only that you reach the broker’s queue sooner than you would otherwise.
Example 3: a stock exchange, and who pays
Stock XYZ trades on exchanges A and B, both quoting 100.00 bid / 100.02 ask. At time zero a large sell order moves exchange A to 99.97 / 99.99. Exchange B’s bid is still 100.00 for the next 300 microseconds.
- A fast firm sells 1,000 shares into B’s stale bid at 100.00 and buys 1,000 on A at the ask, 99.99.
- Gross profit: 0.01 × 1,000 = 10.00 USD, which is 1 basis point of the share price.
- If each side costs 0.003 USD per share in fees (an assumption), costs are 6.00 USD and the net is 4.00 USD, or 0.4 basis point.
Now look at the other side. The market maker whose bid was standing at 100.00 bought 1,000 shares when the new mid-price was 99.98. That is a mark-to-market loss of (100.00 − 99.98) × 1,000 = 20.00 USD, twice the winner’s gross gain, because the winner also paid the spread to buy back. Repeated about once a minute per stock, those small transfers are the 0.42 basis point tax the FCA paper measured. They explain why market makers widen quotes, and why investors end up paying for it.
Example 4: how fast is fast enough? A toy break-even model
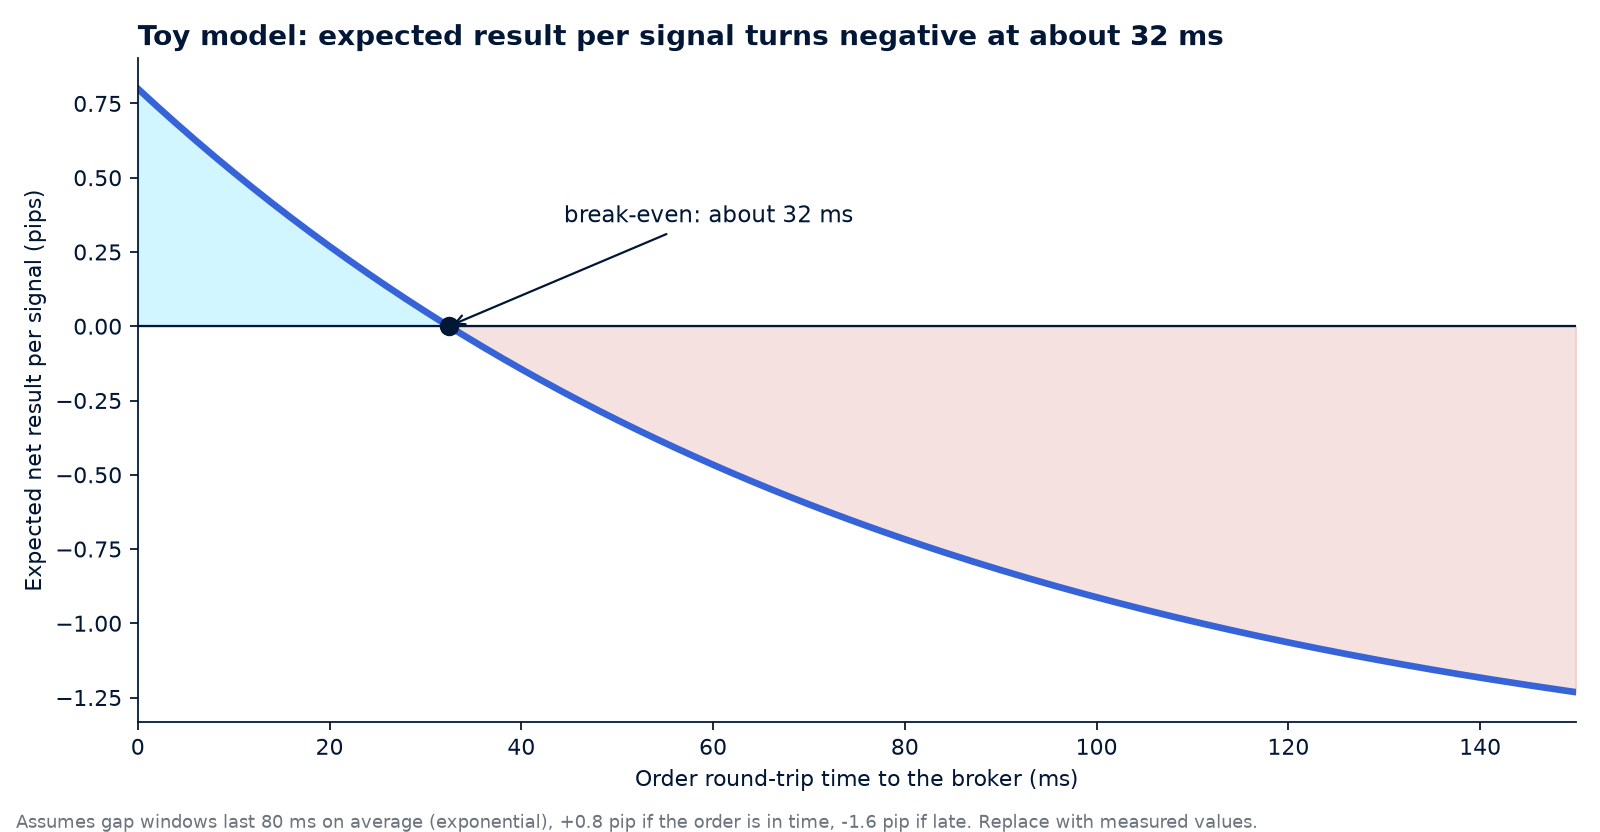
Combine Examples 1 and 2: +0.8 pip when the EUR/USD order lands in time, −1.6 pips when it is late. Suppose the order is in time with probability p, which falls as round-trip time rises, because the window may close first. To keep the model transparent, assume the stale window lasts 80 ms on average and follows an exponential distribution, so p = e−T/80 for round-trip time T in milliseconds. The expected result per signal is p × 0.8 + (1 − p) × (−1.6) pips.
| Round-trip time | Order in time | Expected result (pips) | Per standard lot (USD) |
|---|---|---|---|
| 5 ms | 93.9% | +0.65 | +6.55 |
| 10 ms | 88.2% | +0.52 | +5.18 |
| 20 ms | 77.9% | +0.27 | +2.69 |
| 30 ms | 68.7% | +0.05 | +0.49 |
| About 32 ms | 66.7% | 0.00 | 0.00 |
| 50 ms | 53.5% | −0.32 | −3.15 |
| 100 ms | 28.7% | −0.91 | −9.12 |
What a Latency Arbitrage System Needs
Whether on an exchange or a retail broker, the system has the same five parts, and the weakest one sets the speed of the whole.
| Part | Job | What to check |
|---|---|---|
| Fast reference feed | Shows the new price before the slow venue does | Where it comes from, whether the prices are executable, and its own delay to you |
| Execution connection | Receives the broker quote and sends orders | FIX, API or MetaTrader, and the protocol’s overhead. A fast protocol does not fix a slow broker |
| Decision logic | Compares the two sources, applies thresholds and costs | Cross-side comparison, spread and slippage limits, one position per symbol |
| Risk controls | Cap size, exposure and behaviour after a disconnect | A stop-all control and sensible limits at the broker too |
| Hosting and route | Put the code close to the endpoints | Round-trip time you measured, not a brochure figure |
A latency budget helps to see where time goes. Typical contributors, with no universal values, are the delay of the fast feed to your server, your own processing, the network path to the broker, the broker’s gateway and queue, and the reply back. Only the middle ones are in your control, and the largest is usually distance. That is why hosting matters, and why a lower ping to the wrong endpoint helps nothing. See VPS for forex arbitrage for choosing a server by measurement, and what an exchange-grade stack costs for the other end of the scale. For market data protocols, the ITCH market data feed page explains what a binary feed looks like, and the FIX API trader page covers the order side.
The software that ties the parts together is what most people call a terminal. For a retail broker setup, platform and terminal mean the same thing: one program that holds both connections, the decision logic and the risk controls.
How to Test Your Broker for Latency Arbitrage
The most useful thing you can do before funding anything is to replace every borrowed number with a measured one. You need two recordings, taken at the same time, and about an hour of data per symbol.
- Record both sources. Log every tick from the fast source and from the broker, each with the time it arrived at your server. Use one clock for both. Source timestamps and local arrival timestamps are different things; keep both.
- Compute cross-side gaps. For a buy, fast bid minus broker ask. For a sell, broker bid minus fast ask. Spreads are already inside these numbers, so do not subtract them again.
- Find the windows. A window opens when the gap exceeds your cost threshold and closes when it returns to zero or below. Record its size and how long it lasted.
- Look at the distribution. How many windows per hour, how long the median lasts, how often they exceed your measured round-trip time. If most close in a few milliseconds, no hosting will rescue the idea.
- Test fills at the minimum lot. Send three to five orders. Record signal-to-fill time, slippage, rejections and whether stops are accepted.
A compact version of step 3 in Python looks like this. It is a teaching sketch for recorded data, not a trading program.
def find_windows(fast, slow, threshold):
    """fast, slow: lists of (t_ms, bid, ask), sorted by time.
    Returns (start_ms, end_ms, peak_gap) for each stale-quote window."""
    events = sorted([(t, "f", b, a) for t, b, a in fast] +
                    [(t, "s", b, a) for t, b, a in slow])
    fb = fa = sb = sa = None
    start, peak, out = None, 0.0, []
    for t, src, bid, ask in events:
        if src == "f":
            fb, fa = bid, ask
        else:
            sb, sa = bid, ask
        if None in (fb, fa, sb, sa):
            continue
        gap = max(fb - sa, sb - fa)      # cross-side gap, buy or sell
        if gap > threshold:
            if start is None:
                start, peak = t, gap
            peak = max(peak, gap)
        elif start is not None:
            out.append((start, t, peak))
            start = None
    return out
Feed it the EUR/USD quotes from Example 1 (fast bid 1.08530 against a stale broker ask of 1.08510), with the fast update at 100 ms and the broker update at 160 ms, and it returns one window of 60 ms with a 2.0 pip peak. On real data the interesting output is the histogram of those durations. Westernpips Private 7 includes an Analyser and a BackTester for recorded quotes that are meant for this kind of review; check the current documentation for exactly what each records and simulates. The documentation guide how to check which quote feed is faster covers the same question inside the product.
Measured: Three Brokers on Gold, a Fast Feed Against Each
To replace borrowed numbers with measured ones, we ran the method above on tick files saved from three Westernpips Private 7 sessions: XAUUSD on three different days, a fast reference feed against three retail brokers, called A, B and C (names withheld). The full method, robustness checks and limits are in the Westernpips XAUUSD Latency Study (2026). These are three single sessions, so they are worked case studies, not a ranking of brokers or a statement about the market.
A window opens when the cross-side gap between the two sources exceeds a threshold and closes when it falls back. The gap is net of both spreads. The table uses a 30-point gap (a point is 0.01 USD per ounce). For gold, 1 pip is taken as 10 points, so 30 points is 3 pips. The “result” columns, in points, are the mean gross move per signal on displayed quotes if the order reached the broker 30 or 100 ms after the signal and was closed one second later, with the spread paid.
| Broker | Broker quote updates per second | Median window | 90th percentile | Open longer than 100 ms | Result at 30 ms | Result at 100 ms |
|---|---|---|---|---|---|---|
| A (spread 10 points) | 2.7 | 50 ms | 217 ms | 31% | +22 | +10 |
| B (spread 12 points) | 9.2 | 34 ms | 200 ms | 19% | +12 | −1 |
| C (spread 46 points) | 6.2 | 56 ms | 201 ms | 25% | +2 | −17 |
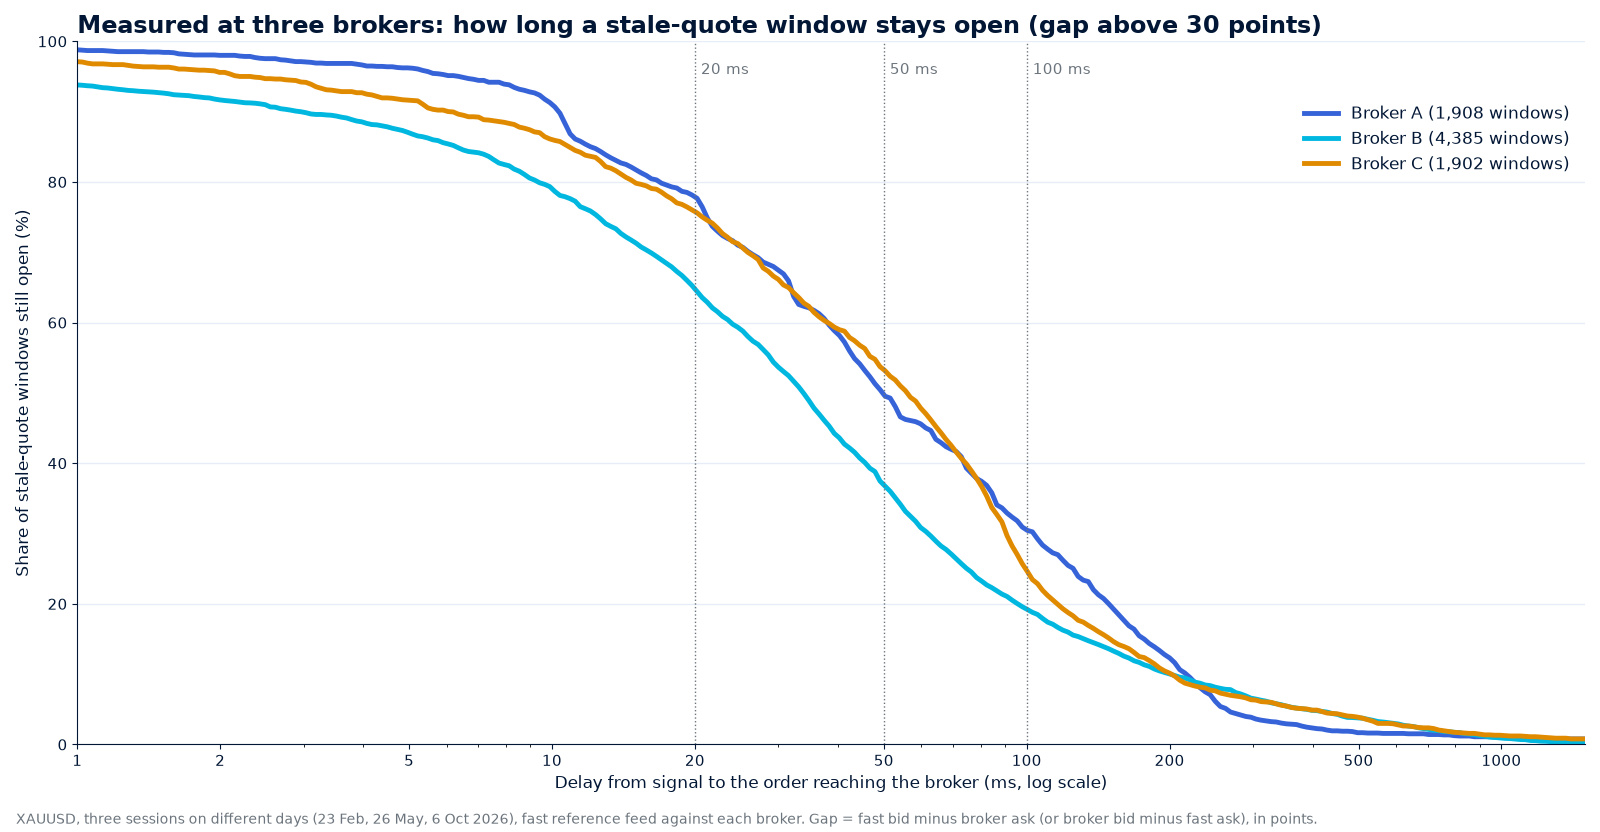
Compare this with the published “50–200 ms” figure. The medians (34, 50 and 56 ms) sit inside it, but each distribution is wide: 22% to 35% of windows closed within 20 ms, and 19% to 31% stayed open for more than 100 ms. The delay at which the mean result reached zero differed far more than the medians did: beyond 150 ms at broker A, about 90 ms at broker B, and about 40 ms at broker C, whose wide spread absorbs most of the edge. Random entries lost about the spread at each broker (9, 12 and 49 points).
At brokers A and B the decline is gentler than in the toy model above, because the broker moved toward the fast price in small steps, so a late order still caught part of the move. Broker C is closest to the toy model.
How Brokers Detect and Stop Latency Arbitrage
The party that loses money to a stale quote has every reason to stop it, and the defences have become a field of their own. They fall into three families.
| Defence | How it works | Where you meet it |
|---|---|---|
| Wider spreads | Price in the expected cost of being sniped, as the FCA paper describes for exchanges | Everywhere, usually invisibly |
| Last look | The liquidity provider holds an order briefly and may reject it if the price moved. One broker-technology firm puts typical windows at 10 to 200 ms. The Global Foreign Exchange Committee’s guidance describes it as a limited price and validity check, and warns liquidity providers against misusing information from rejected trades | Some ECNs and bank liquidity providers |
| Execution-quality controls | Asymmetric slippage, requotes, added delay or rejections for accounts whose fills look unusually good | Broker servers, described by brokers and by firms that sell the controls |
| Account measures | Restrict instruments or size, void trades, withhold profit, close the account | The client agreement |
| Market design | Speed bumps (IEX adds a 350-microsecond delay), frequent batch auctions, randomised execution times, or an order type that fixes the execution time | Exchanges and proposed rules; Budish and co-authors, the BIS and a Springer paper study them |
Brokers and liquidity providers track the problem with a few numbers: whether trades move against them straight after execution (often called toxic flow), rejection rates, and hold time, meaning how long an order waits before it is accepted or rejected. LMAX Exchange publishes a transaction-cost-analysis note on hold time for exactly this reason. Traders can watch the same statistics from their side.
The practical consequence for a trader is that the edge is not only technical. A broker that sees a pattern may degrade execution without telling you, and the first sign is usually your own logs: slippage that is worse in your favour than against you. Keep records, and compare them with the gap data from the measurement step.
Is Latency Arbitrage Legal? Law vs Broker Rules
Two questions get mixed up: whether the strategy is illegal, and whether your broker allows it.
The criminal-law question. Trading against a published price is generally not an offence. Regulators focus on manipulation, spoofing, fraud and misleading conduct, not on being fast. The line is intent and method: arbitrage exploits a gap that already exists, while manipulation creates one. Rules differ by jurisdiction, and this page is not legal advice.
The contract question. This is where retail traders get hurt. Many client agreements prohibit arbitrage or latency trading and give the broker discretion to void trades or withhold profit. Two published decisions of the UK Financial Ombudsman Service show how that plays out:
- Decision DRN2518059 (Vantage FX UK). The broker revoked trades and removed about 2,000 euros of profit, saying the client had used price latency arbitrage. Its client agreement said such trading could not exist in an over-the-counter market and was not permitted, and the ombudsman noted that cancelling such trades is common industry practice. The decision turned on a different clause: the ombudsman found it more likely than not that the client breached the ban on third-party access by letting an automated trading service use his account, and did not uphold the complaint.
- Decision DRN-4314274 (TigerWit, 2023). The broker withheld a withdrawal after finding patterns suggesting an automated method that traded ahead of its price updates, particularly when a price move exceeded its spread within a period shorter than its pricing latency. Its prices sat slightly behind the underlying futures exchanges. The ombudsman found it reasonable for the broker to rely on its terms and withhold the profits.
Latency Arbitrage vs Other Arbitrage Strategies
| Type | Edge comes from | Main cost or risk | Hardest part |
|---|---|---|---|
| Latency arbitrage | A slow quote | Late fills, rejections, broker action | Being faster than the window, and staying permitted |
| Triangular | Three pairs out of line at once | Spreads on three legs | Gaps are rarely larger than combined spreads |
| Statistical | Mean reversion of related instruments | The relationship breaks | Model risk, not speed |
| Cross-exchange (crypto) | A price difference between venues | Fees, transfer time, inventory | Moving capital faster than the gap closes |
If you want a version with a capped, small loss while you learn, the risk limits are written out in the low-risk HFT trading guide: minimum lot, a short stop, no martingale. For the first week of setup, see getting started step by step.
Five Common Mistakes
- Treating every price gap as a delayed quote. Sources can differ because of liquidity pools, markups or contract specifications. Compare the same symbol, contract, session and units, and check timestamps, before attributing a difference to latency.
- Confusing a low ping with an edge. Ping measures one leg to one server. The edge is the difference between your speed and the window, and it exists only when the broker is slower than you.
- Trusting a backtest that fills at the signal price. A zero-latency fill removes the late-order loss shown in Example 2 (−1.6 pips on the EUR/USD trade, against +0.8 pip when the order is in time). A useful test models execution delay, slippage on both legs and variable spread.
- Assuming more speed always wins. On exchanges the profit pool is shared by the fastest few. In retail, the edge also shrinks as more traders target the same slow broker, and as the broker reduces its lag.
- Equating legal with allowed. Not being a crime does not stop a broker from voiding trades under its agreement, as the ombudsman decisions above show.
Latency Arbitrage Software: Westernpips Private 7
Disclosure: Westernpips publishes this page and develops the software mentioned here. It is educational material, not an independent ranking.
Westernpips develops software for comparing market data, configuring arbitrage strategies and reviewing results. Westernpips Private 7 connects to fast data sources and broker accounts through FIX, API and MetaTrader connectors, runs strategies such as OneLeg and TwoLeg, and includes a BackTester and an Analyser for reviewing recorded data before trading live. The connector list in the documentation shows what it can reach.
Use it the way this page recommends for any tool: record both sources, measure your round-trip time, trade the minimum lot, and read the logs. Available markets and connections depend on the product version and on provider access, and performance depends on the feed, the broker, the hosting and the execution conditions. Published trading statements show results with their account conditions, reporting periods, costs and drawdowns, and results from one setup do not establish what another account will get.
Latency Arbitrage Tutorials
Use these videos to review setup, recorded-data analysis and execution terminology. Interfaces and supported features may differ by version.
Review recorded tick data and strategy settings in the Back Tester. Historical simulations depend on the data and execution assumptions; they do not reproduce every live fill or establish future profitability.
This guide covers the Analyser and BackTester workflow for recorded quotes and strategy parameters. Evaluate assumptions about fees, slippage and order handling, and compare simulated results with actual execution logs.
Follow the Private 7 installation and activation walkthrough, then review menus, connection settings and strategy configuration. Confirm supported connectors and account requirements in the current documentation.
A gap is a quote difference between the reference feed and execution source. Slippage is the difference between a requested price and the actual fill. Review both alongside fees and exit prices. See our guide to retail trading risk controls for further discussion; suitable limits depend on the instrument and account.
This guide covers a PrimeXM FIX connection and common session problems. Check credentials, permissions, symbol mapping and session logs. A successful FIX connection does not itself guarantee fast execution.
Latency Arbitrage Glossary
- Stale quote
- A price that a venue or broker still shows after the market elsewhere has already moved. Latency arbitrage trades against it until it updates.
- Fast feed (reference feed)
- A quote source that updates before the broker, usually a liquidity-provider or exchange feed. It is the signal; orders go to the slower broker.
- Cross-side gap
- For a buy, fast bid minus broker ask; for a sell, broker bid minus fast ask. Both spreads are already inside the number, so a positive gap means the stale quote can be traded and exited at the new price.
- Window
- The time during which the cross-side gap stays above the cost threshold. In three recorded gold sessions the median window at a 30-point gap was 34 to 56 ms.
- Round-trip time (RTT)
- The time from sending an order to receiving the broker response. It includes the broker gateway and queue, so it is longer than a network ping.
- Pip
- The quoting unit for most currency pairs: 0.0001 (0.01 for yen pairs). On EUR/USD one pip is worth 10 USD per standard lot of 100,000 units.
- Point (gold)
- On XAUUSD, 0.01 USD per ounce. This page takes 10 points as 1 pip, so a 30-point gap is 3 pips.
- Slippage
- The difference between the price requested and the price filled. In latency arbitrage it is measured on both the entry and the exit.
- Last look
- A short hold in which a liquidity provider checks price and validity and may reject the order. The GFXC says it should be used for those checks only.
- Hold time
- How long an order waits before a liquidity provider accepts or rejects it under last look.
- Toxic flow
- Order flow that tends to move against the liquidity provider immediately after execution. Brokers use the term for latency arbitrage.
Latency Arbitrage FAQ
What is latency arbitrage?
How does latency arbitrage work in forex?
Is latency arbitrage legal?
How fast do you need to be?
How much can latency arbitrage make?
Why do brokers ban latency arbitrage?
Is latency arbitrage the same as HFT?
What is the difference between latency arbitrage and triangular arbitrage?
Can you do latency arbitrage manually?
How can I test whether a broker quote is slow?
Sources
Research and decisions cited on this page, in the order they appear. Figures for retail gold come from the Westernpips XAUUSD Latency Study (2026).
- Budish, E., Cramton, P. and Shim, J. (2015). The High-Frequency Trading Arms Race: Frequent Batch Auctions as a Market Design Response. Quarterly Journal of Economics, 130(4), 1547–1621.
- Aquilina, M., Budish, E. and O’Neill, P. (2020). Quantifying the High-Frequency Trading “Arms Race”: A Simple New Methodology and Estimates. Financial Conduct Authority, Occasional Paper No. 50.
- Aquilina, M., Budish, E. and O’Neill, P. (2022). Quantifying the High-Frequency Trading “Arms Race”. Quarterly Journal of Economics, 137(1), 493–564.
- Aquilina, M., Foley, S., O’Neill, P. and Ruf, T. (2023). Sharks in the dark: quantifying HFT dark pool latency arbitrage. Bank for International Settlements, Working Papers No. 1115.
- Wah, E. and Wellman, M. P. (2013). Latency arbitrage, market fragmentation, and efficiency: a two-market model. Proceedings of the 14th ACM Conference on Electronic Commerce.
- Global Foreign Exchange Committee (2021). Guidance paper on last look, published alongside the FX Global Code (Principle 17).
- Financial Ombudsman Service. Final decision DRN2518059: complaint against Vantage FX UK Trading Limited (price latency arbitrage, trades revoked; complaint not upheld).
- Financial Ombudsman Service (2023). Final decision DRN-4314274: complaint against TigerWit Limited (latency trading, profits withheld; complaint not upheld).

Westernpips has developed software for latency arbitrage and high-frequency trading since 2007. This guide was written and checked by the Westernpips team, who build, connect and test the trading software described in it. The XAUUSD figures come from our own recorded sessions, and the method is published in the Westernpips XAUUSD Latency Study (2026) so it can be repeated.
Risk warning: trading leveraged products involves a high risk of loss. This article is educational and is not investment advice or legal advice. Prices in the worked examples and the break-even model are hypothetical illustrations written by Westernpips. The measured section uses recorded quotes from three single sessions at three brokers and shows displayed prices, not executed trades. Research figures are quoted from the published studies named in the text. Execution, spreads and permitted strategies vary by broker.